The Executive Dashboard: Building Real-Time Data Pipelines for C-Suite Clarity
Stop Running Your Business in the Rearview Mirror
If your executive team relies on end-of-the-month spreadsheets to make critical business decisions, you are flying blind. By the time the data is manually exported, cleaned, and presented, it is already obsolete. In high-stakes B2B environments, relying on fragmented data scattered across marketing platforms, CRMs, and financial software creates hesitation, conflicting reports, and missed opportunities.
This guide breaks down how Growth Engineering replaces the "spreadsheet scramble" with automated, real-time data pipelines—giving the C-Suite instant, centralized clarity over the entire organization's performance.
📍 What Is a Custom Executive Dashboard?
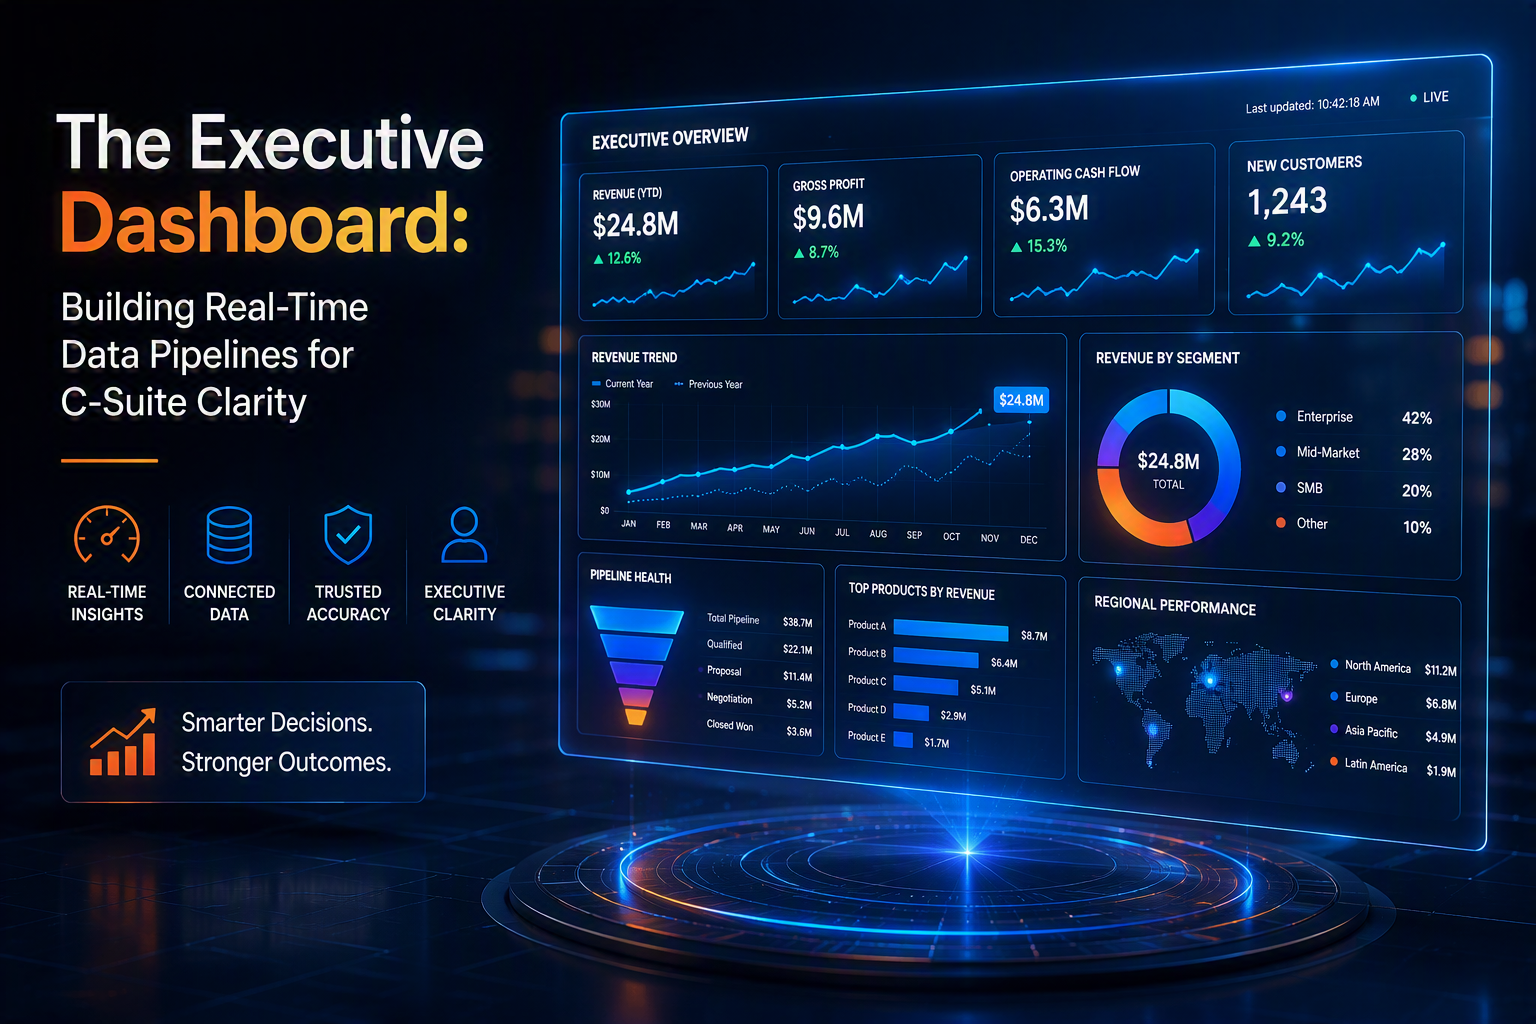
An Executive Dashboard is a centralized, engineered interface that autonomously pulls raw data from every software tool in your business, normalizes it, and visualizes your most critical Key Performance Indicators (KPIs) in real time, with zero manual input required.
Why It Matters:
- Data Decay: Business decisions based on week-old data carry a massive margin of error in fast-moving markets.
- The "Truth" Conflict: When Sales pulls numbers from a CRM and Finance pulls from accounting software, the numbers rarely match. A centralized dashboard creates a single source of truth.
- Cost of Reporting: Manual reporting costs mid-market companies hundreds of high-value administrative hours every single month.
🧠 Understand the Data Pipeline Ecosystem
A true executive dashboard isn’t just a pretty graph; it is the visual output of a robust, engineered backend architecture.
Key Players:
- The Sources: Your existing software (CRMs, ad platforms, payment gateways, legacy ERPs).
- The Pipeline: Automated API connections and ETL (Extract, Transform, Load) scripts.
- The Data Warehouse: A highly secure, centralized database (like Supabase or PostgreSQL).
- The Visualization Layer: A custom, lightning-fast Next.js frontend built precisely for your leadership team.
🗺️ Optimize Your Reporting Infrastructure
To get real-time clarity, you must completely eliminate humans from the data-gathering process. If an employee has to click "Export to CSV," the system is broken.
Steps to Automate:
- Audit and map every software platform where critical business data lives.
- Define the 5 to 7 "North Star" metrics that actually drive business growth.
- Engineer direct API connections to extract data from the source tools instantly.
- Normalize the data into a centralized, owned database.
- Deploy a secure, web-based portal for executives to view the live metrics.
Contact For a Free Business AssessmentPro Tip: Beware of "Vanity Metrics." A true executive dashboard should be fiercely curated. If a metric goes up or down and doesn't immediately dictate a change in business strategy, remove it from the C-Suite view.
📝 Engineer a Single Source of Truth
In most companies, data lives in silos. Marketing has their numbers, Sales has theirs, and Operations operates on gut feeling. By engineering a central data warehouse, you force all departments to align. When the CEO looks at the Cost of Customer Acquisition (CAC), the dashboard is pulling ad spend directly from source channels and dividing it by closed-won contracts in the CRM—producing an undeniable, mathematically perfect number.
🌐 Ensure Real-Time Syncing Across the Stack
Legacy reporting relies on "batch processing"—where systems update once every 24 hours at midnight. Modern Growth Engineering utilizes webhooks and real-time database listeners. When a high-ticket invoice is paid via Stripe, the revenue graph on the CEO's dashboard ticks upward less than a second later.
⭐ Customize Views with Role-Based Access (RBAC)
An off-the-shelf dashboard gives everyone the same generic view. A custom-engineered dashboard serves specific insights to specific leaders.
The Power of Custom Views:
- The CEO sees total revenue, overall profit margins, and high-level pipeline health.
- The VP of Sales sees individual rep closing ratios and speed-to-lead times.
- The VP of Operations sees current server load, active client onboarding statuses, and team utilization rates.
- One application, dynamically adapting to the user's secure login credentials.
🔗 Connect the Disconnected (Even Legacy Systems)
One of the biggest hurdles to C-Suite clarity is an old, clunky piece of legacy software that "doesn't integrate with anything." Growth Engineers don't rely on basic visual workflow tools for this. By writing custom middleware, we can bridge the gap between years-old on-premise ERPs and modern cloud dashboards, finally unlocking the data trapped inside your oldest systems.
📱 Build for On-the-Go Leadership
Executives aren't always sitting at their desks. Custom dashboards built with modern web frameworks like Next.js and Tailwind CSS are inherently responsive. Whether you are pulling up Q3 revenue projections on your phone in an airport lounge or projecting it onto a screen in the boardroom, the UI scales perfectly.
📊 Track Your Dashboard ROI
The value of an executive dashboard is measured by the speed of leadership execution.
Metrics to Watch:
- Reduction in administrative hours spent building end-of-month reports.
- Decrease in the time it takes to identify and react to a drop in sales pipeline volume.
- Increase in forecasting accuracy.
🧩 Advanced Analytics Strategies
Ready to level up your data infrastructure? Try these:
- Automated Anomaly Detection: Engineer the system to send an automated SMS alert to the leadership team if daily revenue drops 20% below the 30-day moving average.
- Predictive AI Forecasting: Feed your historical database into machine learning models to accurately predict next quarter's cash flow based on current pipeline velocity.
- Automated Board Reports: Program the dashboard to generate and email a perfectly formatted PDF summary to stakeholders every Friday at 5:00 PM.
💡 Final Thoughts
An Executive Dashboard is more than a convenience—it is a strategic weapon. By engineering real-time data pipelines, you eliminate guesswork, destroy departmental silos, and give your leadership team the absolute clarity required to make aggressive, confident decisions.
🚀 Talk to a Growth Engineer Today